In my day to day job I use SCOM, among other tools, as part of our monitoring suite, and let’s be honest SCOM dashboards can be at times :-
- Basic in metrics being reported on, particularly when it comes to VMware/Hyper-V monitoring.
- Very slow, sometimes downright unusable.
Enhancing SCOM monitoring
To address the 1st issue, we have been using Veeam Management Pack (https://www.veeam.com/system-center-management-pack-vmware-hyperv.html) to bolster the monitoring of our environments.
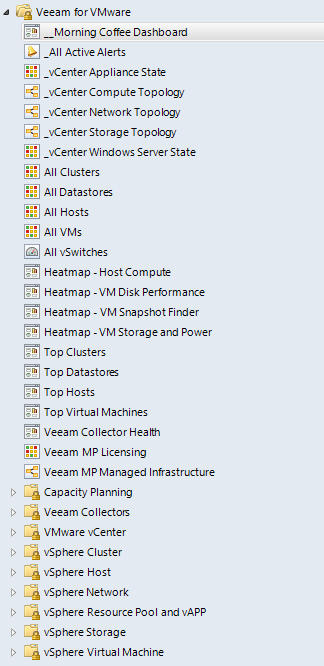
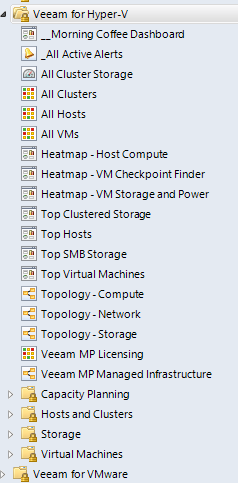
The Veeam MP has a multitude of really usefully metrics/dashboards available ‘out of the box’ : –
VMware
Hyper-V
Including a handy ‘Morning Coffee Dashboard‘, to give you that quick overview of your estate, which includes CPU/Memory and Storage usage as standard :-
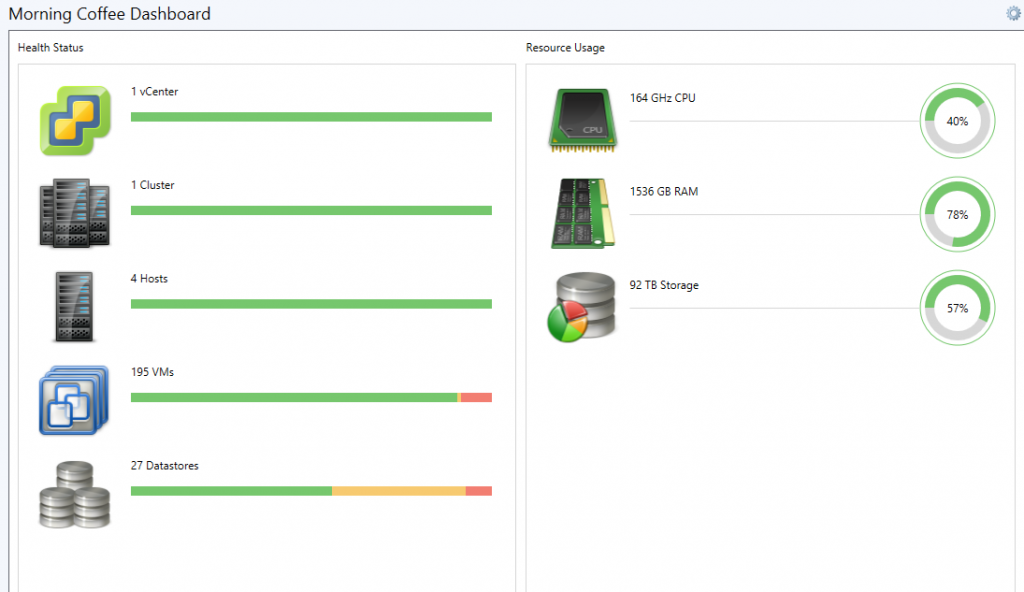
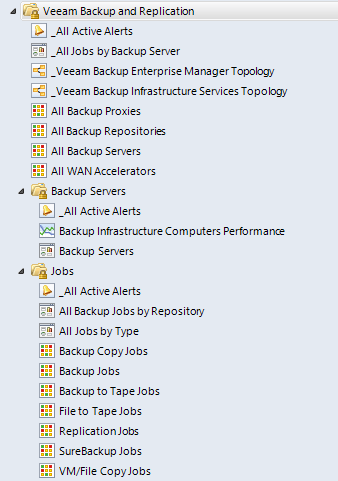
You can also point the MP at your Veeam Back and Replication estate, to help monitor the state backups, backup servers, proxies etc
Veeam Backup and Replication
Speedy Dashboards
Now while Veeam has done a fantastic job of compiling these metrics/dashboards/reports, SCOM does a pretty poor job of display these in a timely fashion.
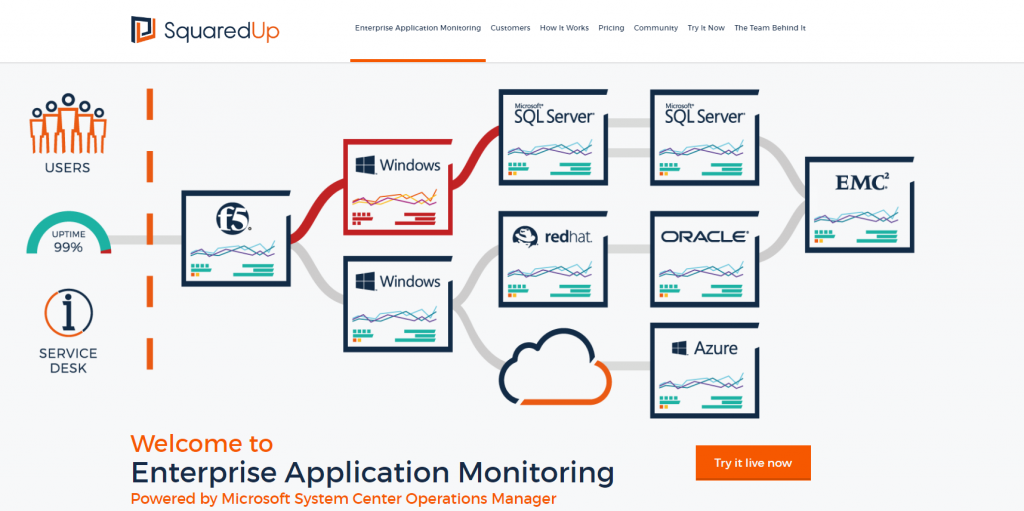
This is where SquaredUp (https://squaredup.com/) comes into its own. SquaredUp provides HTML5 dashboards of your collected SCOM data, accessible from any browser with no need to log into SCOM console or extra agents to install.
Using the same data collected by the Veeam MP, you can quickly present you relevant data in one convenient dashboard.
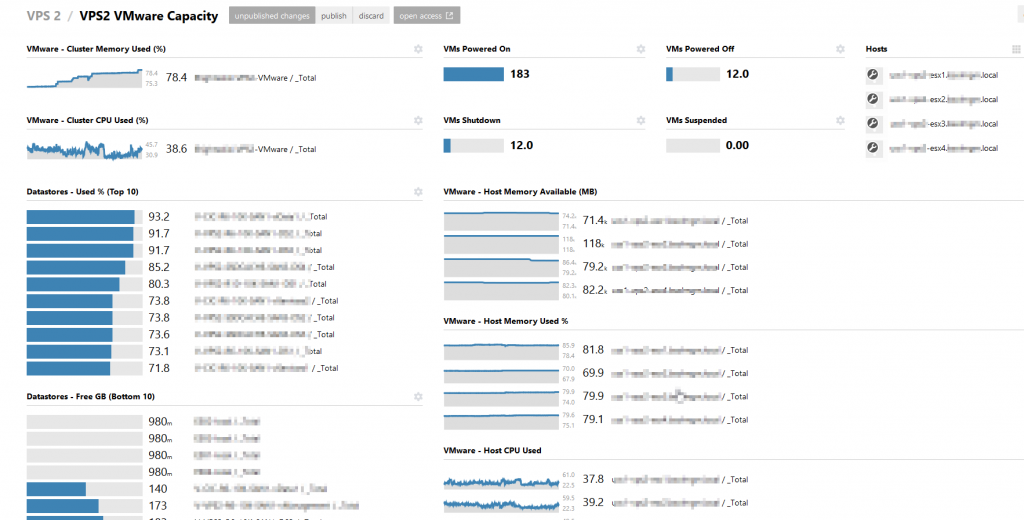
You can find my dashboard on the SquaredUp Community site https://community.squaredup.com/browse/download-info/vmware-capacity/
Veeam MP marketing have a slide where they talk about Veeam MP and SCOM ‘Better together‘
But I’m going to dispute that ….